Data Visualization
TSVMap has created a 10-part series that outlines the process of building a data visualization map for your business. The series covers the following steps:
- Discovery & Documentation
- Interviews
- System Analysis
- Infrastructure
- Data Flow Map
- Design
- Security and Access
- Usability
- Launch
- Maintenance
Each step is explained in detail to guide you through the process of building an effective data visualization map for your business or manufacturing facility. We have started this series with one of the most crucial steps and we have done this as this is the pivotal point of understanding for a great deal of many business and manufactures.
Are you tired of spending countless hours trying to access report data using excel? Look no further than a visualization dashboard. This is a board that you can access via your mobile or desktop device that instantly gives you a clear understanding of where your business is at based on that dashboard being tied into all of your systems. In order to get your visualization dashboard created, you will need to hire or employ someone who has an understanding of hardware, software and a complete understanding of many different systems depending on your business.
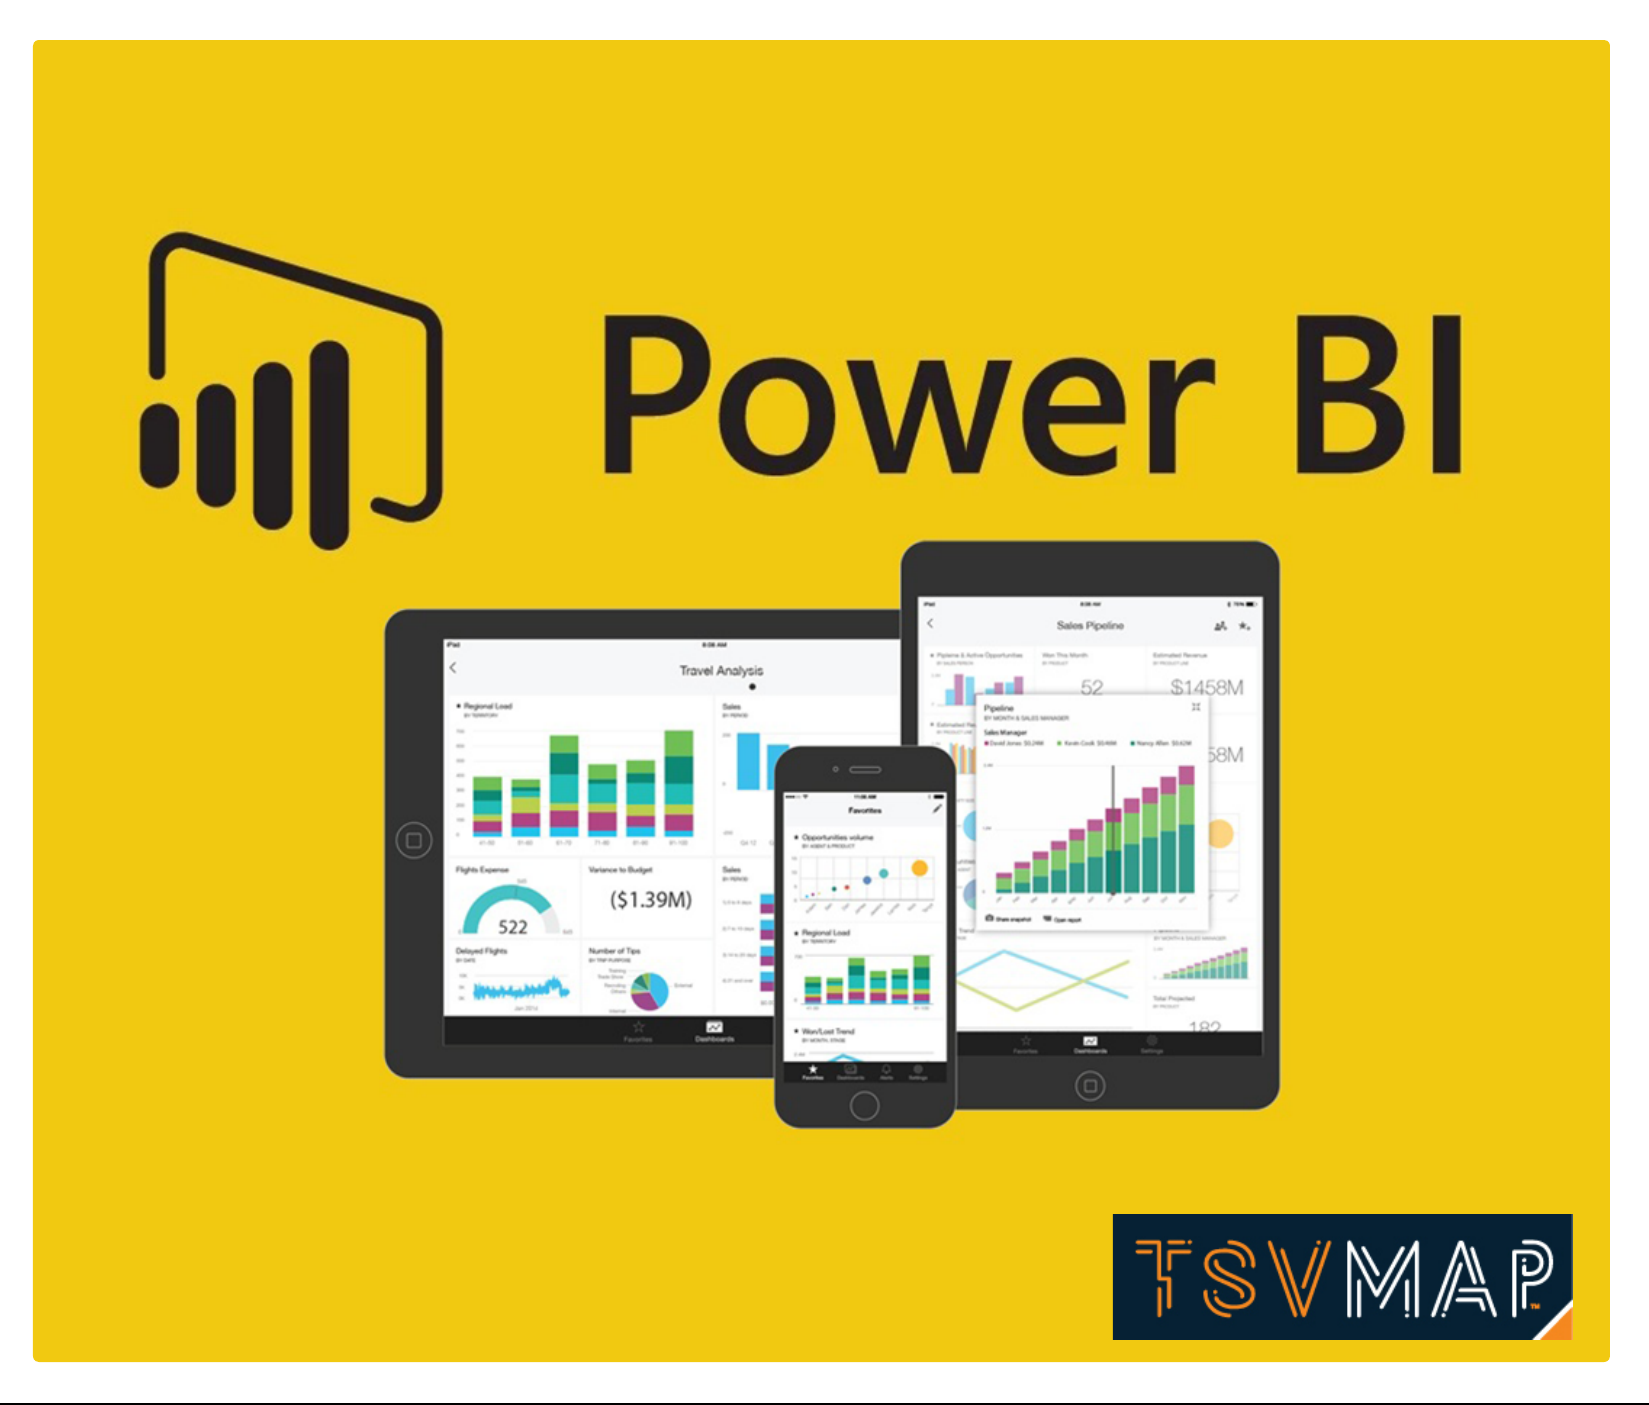
Step number 5 utilized by TSVMap is the process of solving a visualization dashboard; we do this by creating a visualization systems map also know as a Data Flow Map. This map explains in graphics how systems are connected and how the data will flow from one system to another. Furthermore we are specialized in using Power BI, Data Visualization, Hardware and Software. Please see the data visualization system map below as an example.

Manufacturers, companies, and people all learn and comprehend in different ways. That is why when you are planning to create a data visualization dashboard combining multiple types of data coming from multiple streams of input, it is essential to provide not only a detailed explanation of how the data will be connected but also answer many other complexities. You should try to answer these questions repeatedly until you have answers for every part of your data visualization dashboards.

Questions to consider when creating a data visualization dashboard:
- What is the infrastructure being used by each system?
- Who will maintain those systems?
- Do you need to secure those systems?
- How will dashboards be accessed?
When answering these questions, you need to take into account various infrastructure components, such as WiFi, bandwidth provider, access points, routers, firewalls, cloud-based systems, on-premise systems, and security of these systems.
Who will maintain your systems?
Maintaining these systems is critical to a data visualization dashboard. Keeping your data connected and updating constantly is critical so that the dashboard you are viewing does not have outdated information.
Do you need to secure those systems?
Depending upon your business and your requirements, you may need to secure those systems. If you house certain data types, you must be secure and compliant. Additionally, you must constantly be vigilant if your data is maintained in multiple locations and in different environments.
How will you access the dashboard?
Accessing your dashboard can be done via your mobile devices, desktop or can also be tied into formats. The dashboard can be multipurpose and used not only internally but externally to share information with other audiences.
In conclusion, a visualization data process not only gives you information and data at your fingertips but it will dramatically reduce employees’ time building reports, gathering data, and combining all of that data into a monthly or weekly reports. If you would like to discuss your project and learn more about visualization dashboard and how it can save your business time and money. Please feel free to call me (Deveren Werne) at 864-991-5656 or email me at deveren@tsvmap.com
 TSVMap is here to help grow your manufacturing processes and consult on your IT Solutions, that way we can make it more effective and efficient. So if you need: IT Solutions, Consultants, ERP Systems, MRP Systems, Automations, or Cyber Security. Contact us today at 864-991-5656 or Email info@tsvmap.com


0 Comments